Click Click Boom Theres Your Temperature
Introduction
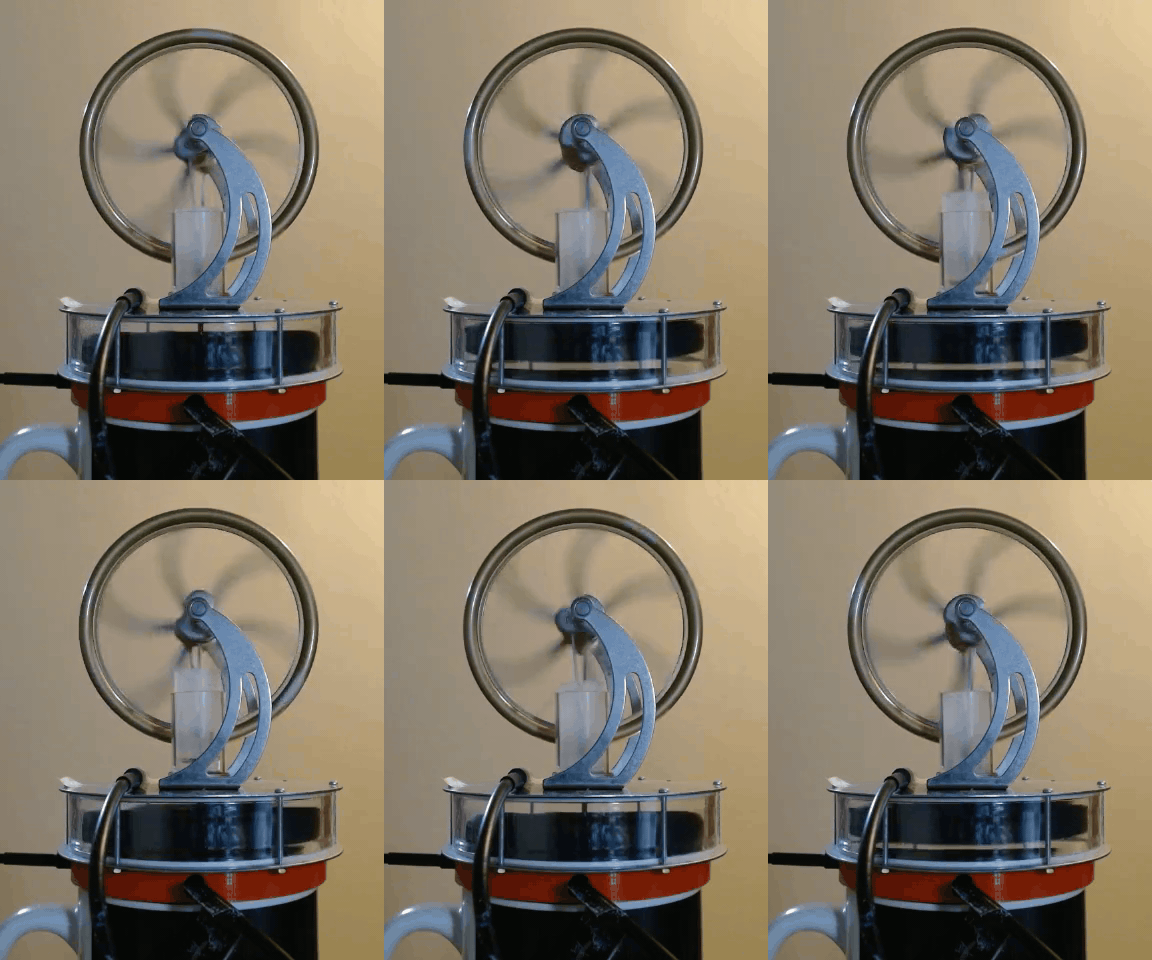
Stirling engines are neat little devices that convert a temperature difference into motion. There are many like it but this one is mine. I like to set it on top of my coffee mug. When it slows down or eventually stops I know the coffee is cool enough to drink.
How It Works
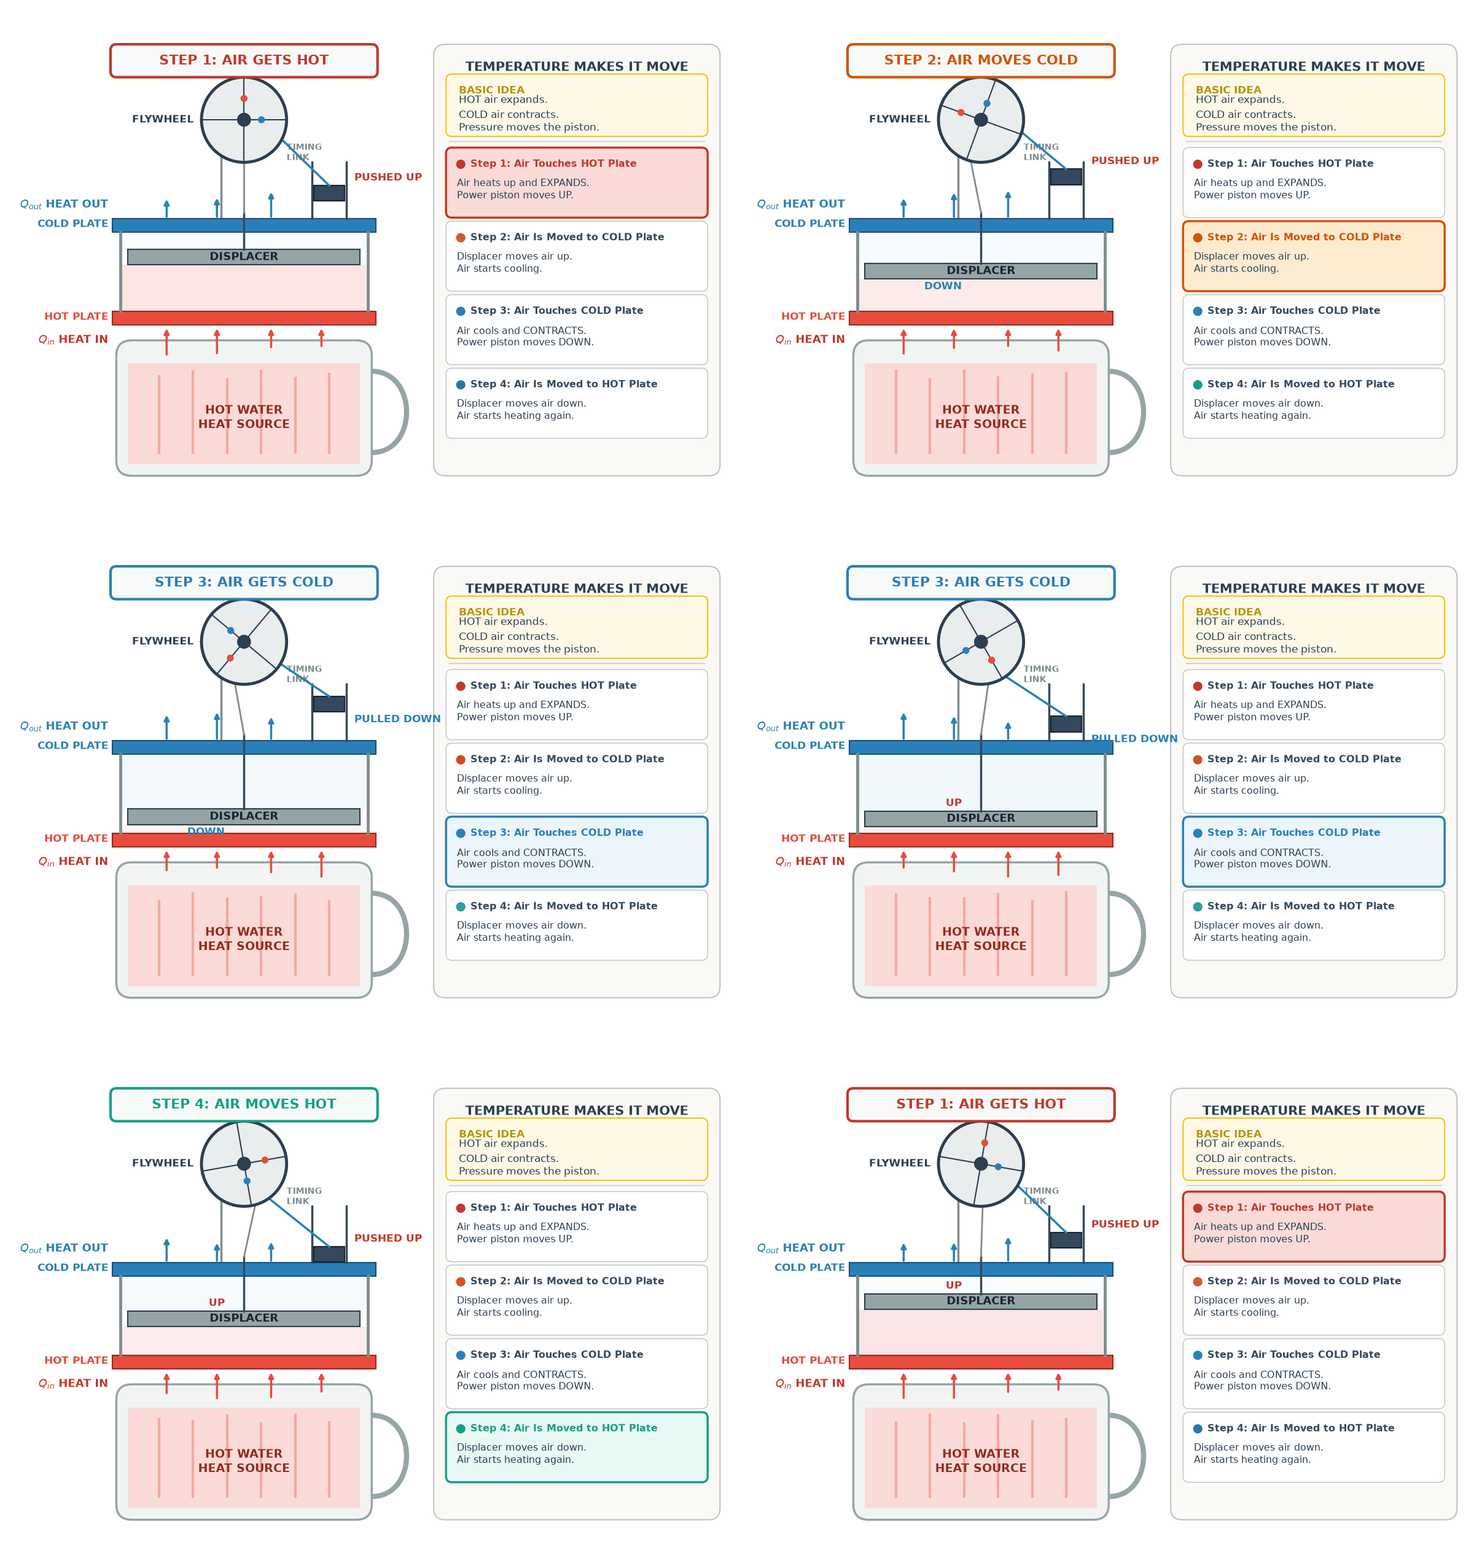
The air inside the chamber is moved back and forth between the hot side (coffee/water) and the cold side (ambient). The temperatures aren’t exactly the same, which I’ll show in the next section, but you get the idea. Heat entering from the hot side leads to expansion and conversely leaving through the cold side leads to contraction. This moves the piston (clear piece above) up and down, thus spinning the flywheel.
Measurements
The typical use case here is the stirling engine sitting on top of a coffee mug. We aren’t expecting a large change in temperature. Maybe 50 degrees? If we start around 200 then thats only 25%. We can assume a linear change in temperature. This assumption is our sniff test when looking at the data.
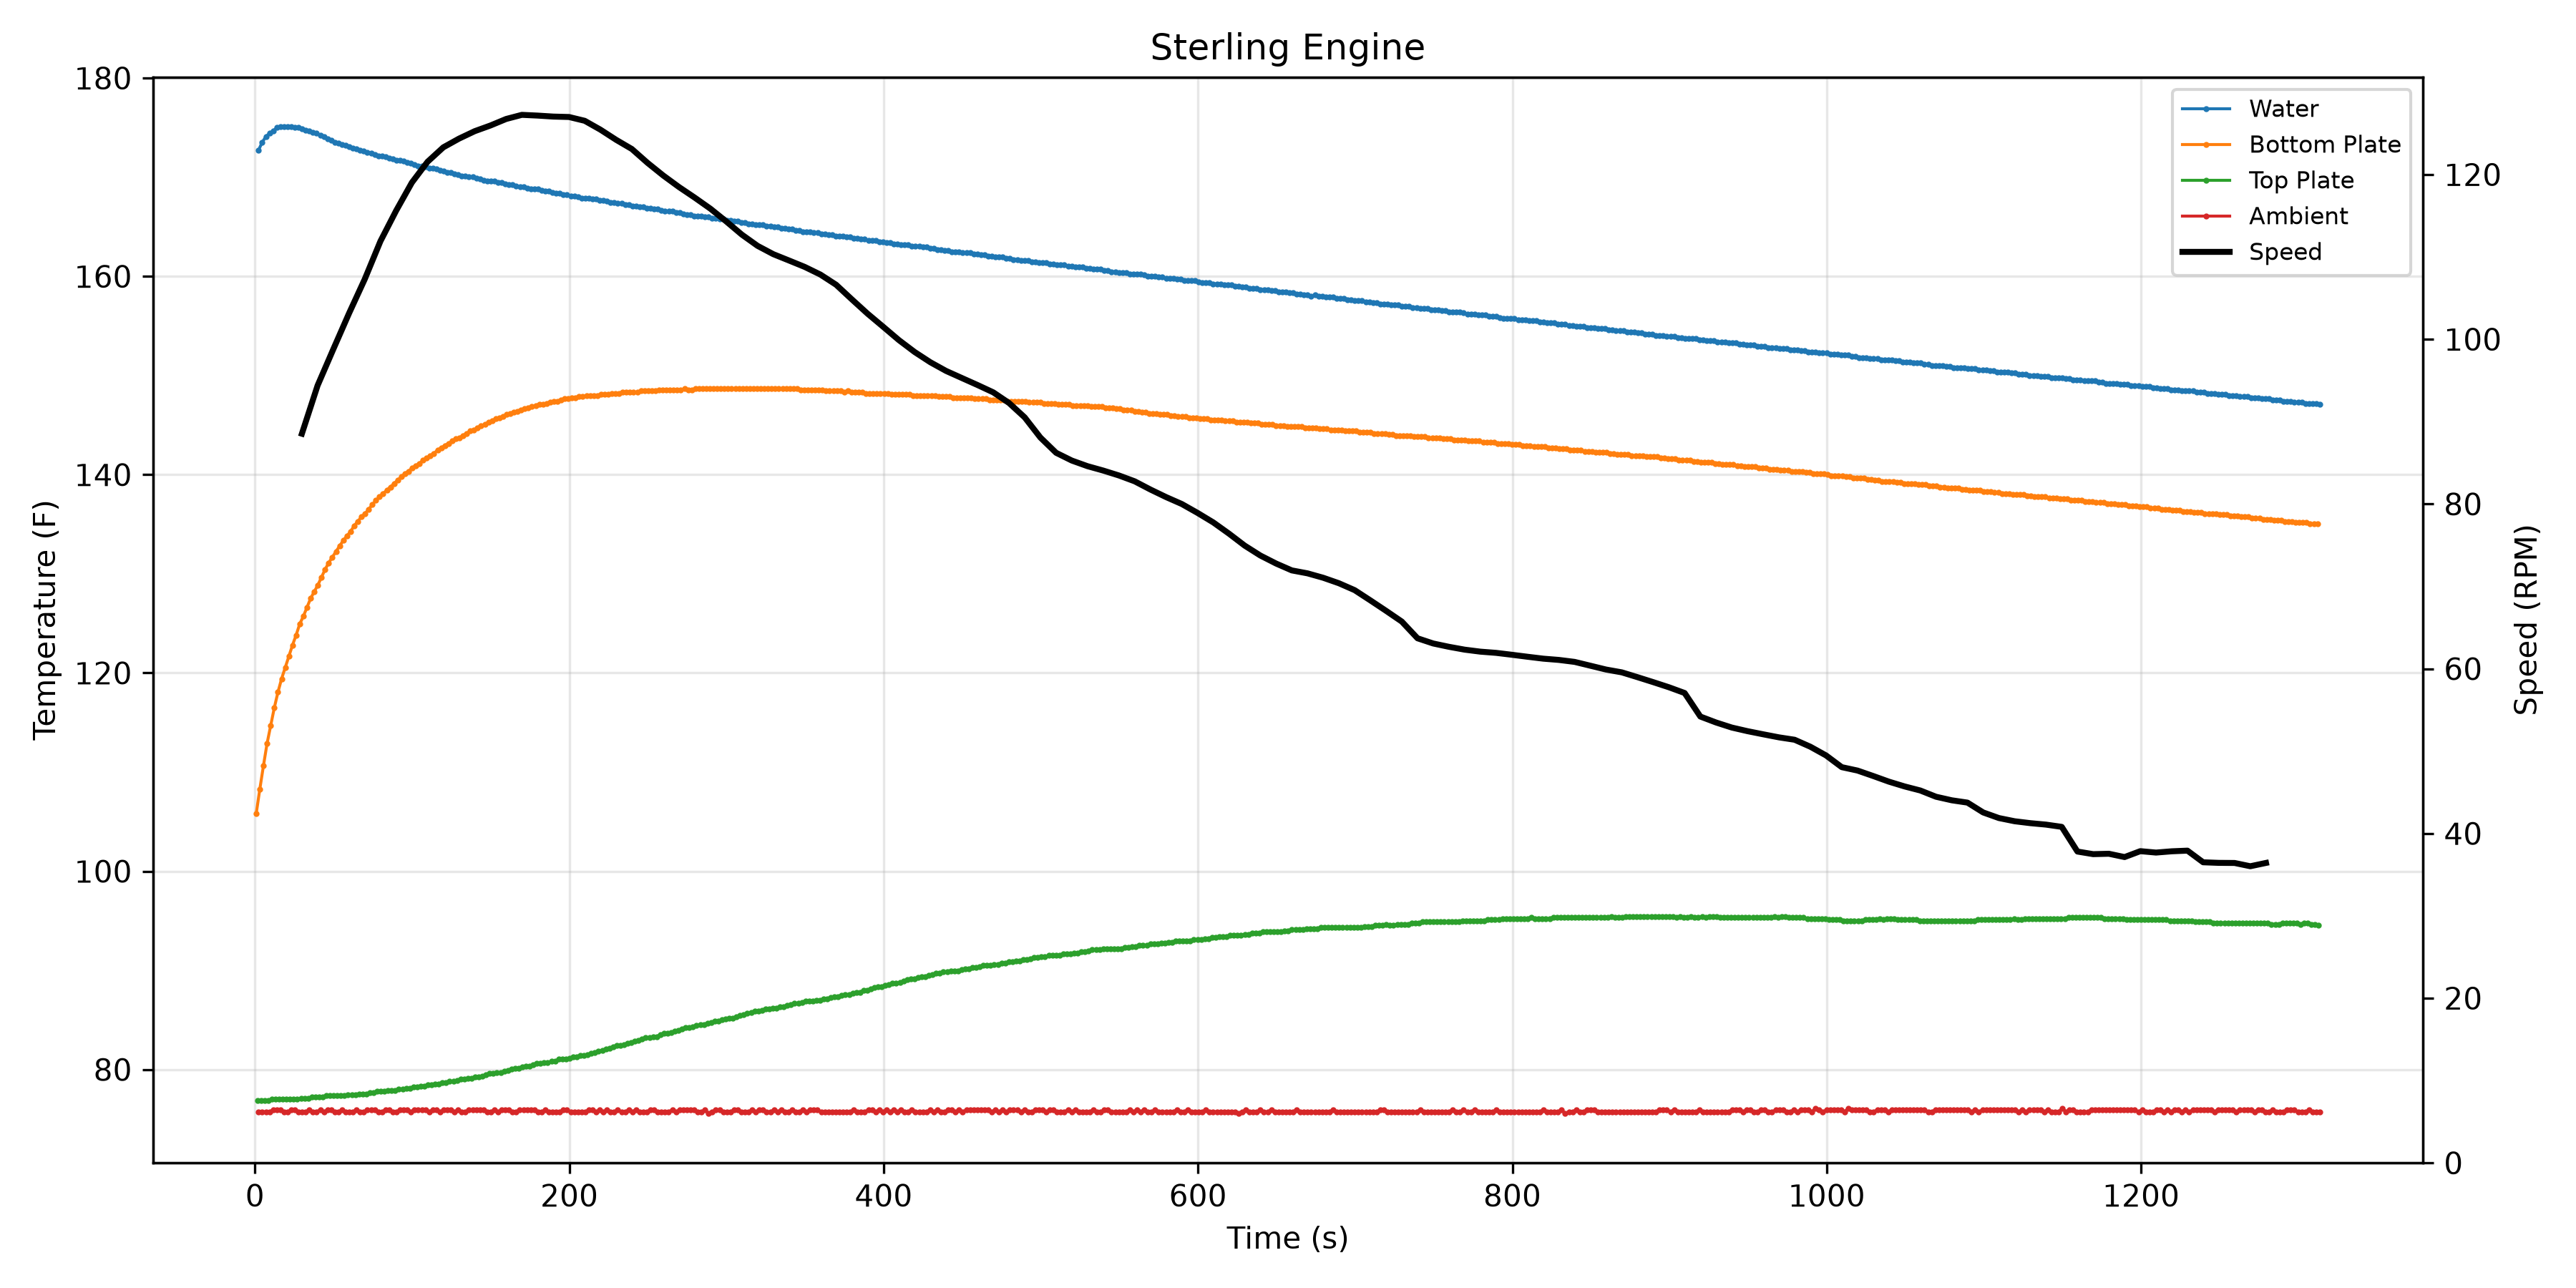
The key data is plotted below. Water temp, hot (bottom) plate temp, flywheel speed, cold (top) plate temp, and ambient temp. You can see it took a few minutes for things to settle into more linear trends. Part of the curve in the hot side temperatures is just the sensors coming up to temperature.
The Water temperature data best shows this because the water can only lose heat once it enters the mug. Some heat will be lost to the mug and some to the air above but no heat is entering the water. Therefore the increase in temperature seen is the thermometer warming up from room temperature.
The Bottom Plate temperature takes longer to peak because it is in an air pocket and up against the bottom plate. Both of these are separate masses that take time to warm up.
The slowest temperature increase is the Top Plate data. This sensor is directly on the top plate but it is not specifically a surface thermometer. Effectively we are measuring the air boundary at the top plate. Close enough, thats the best we can get for now. Heat from the water can be lost through the mug, the air above the water, the air in the stirling engine, some is converted to mechanical energy, and finally used to heat up the top plate. While it looks like it took almost 800 seconds for us to get usable data thats not actually the case, fortunately.
Finally the speed data. It looks as though it never became linear and always had a curve in one direction or another. This makes more sense when we consider that the stirling engine’s speed is dependent on the Top and Bottom, the hot and cold sides. The Water and Ambient temperatures technically don’t matter even though functionally they contribute to the hot and cold side temperatures. We can ignore them for now. More specifically the speed is dependent on the difference between the Top and Bottom temperatures. If you eyeball the difference between those two lines you can see their difference is curved because of how quickly the Bottom warmed up and how slowly the Top warmed up. “Oh yeah, its all coming together now”.
Cool, our data makes sense!
A quick note on measuring the speed of the flywheel. This was an adventure. I initially started with a Time Of Flight sensor trying to catch the spokes, I couldnt read the sensor fast enough. Then I put paper over all but one gap between the spokes, still not fast enough. Then I moved to a webcam I had laying around. Either the lighting, the settings, or the algorithm were not good enough. That was disappoiting but warrants another attempt later as I would like to capture higher fidelity speed data. Finally I landed on using an audio recording. In each cycle the stirling engine clicks twice, once at the top and once at the bottom. I was able to capture this will a simple headset mic.
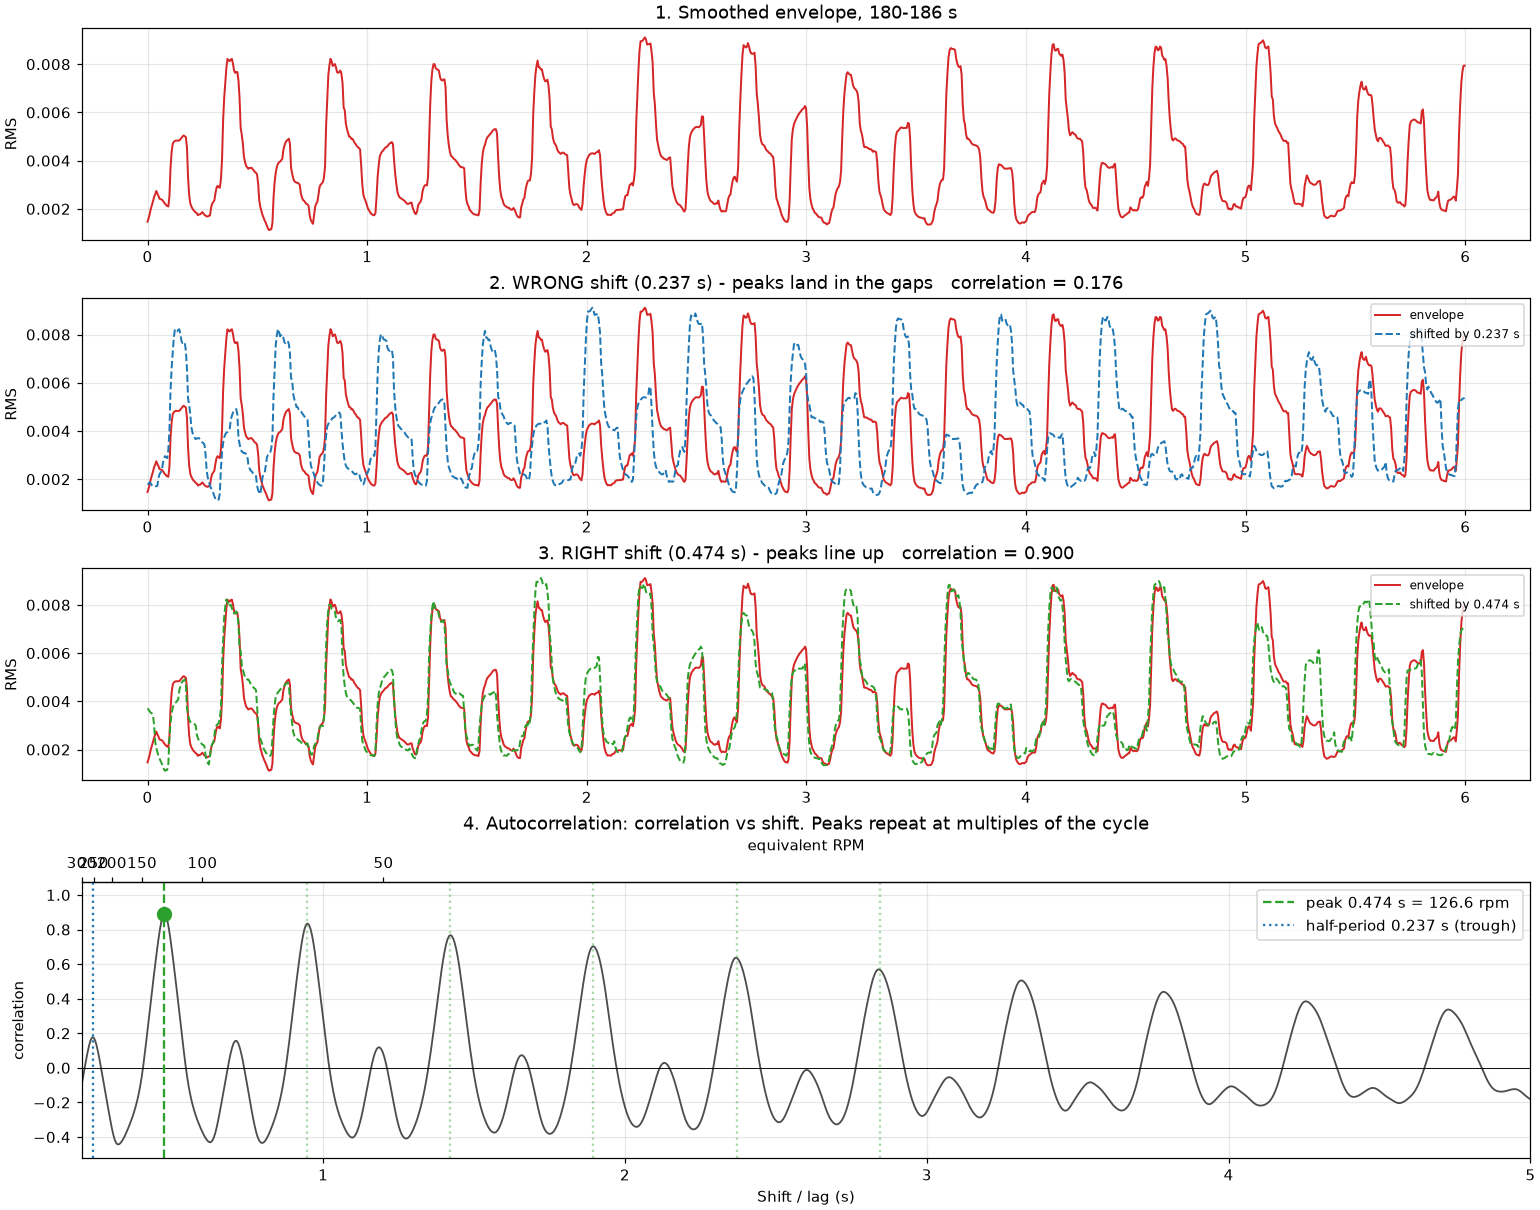
To turn clicks into speed I used autocorrelation. This method takes a signal and shifts it by different amounts of time. The closer the original signal and the time shifted signal match, the higher (closer to 1) the correlation number is. The top plot in the figure below is the “loudness” of the audio signal. We can clearly see two different height peaks that are pretty evenly spaced. This makes sense with the top and bottom clicks one can naturally pick up on. It is helpful that they have different heights. The second and third plots show “wrong” and “right” shifts. We can see that if we align the wrong peaks (shift half a cycle) we get a low correlation value. With the right time shift we can align tall peaks with tall peaks and short peaks with short peaks. We have now found our repeating signal which is the spinning of the flywheel. The amount of time we shifted the signal by is the time difference between similar height peaks i.e. the time it took to complete a revolution. Take seconds per revolution, flip, multiply, boom RPM!
Quick note on the bottom plot. If it takes 0.5 seconds to go from one tall peak to the next tall peak then you know if you shifted 1 second you’d skip the nearest tall peak and land on the following one. The peaks in this graph show these larger jumps that will also land you on a tall peak. Because the speed is slowly changing over time, the longer time period you look at or shift by the more the signals will be different. This is why the correlation decreases.
Using The Data
Now the fun part! What can we do with this??
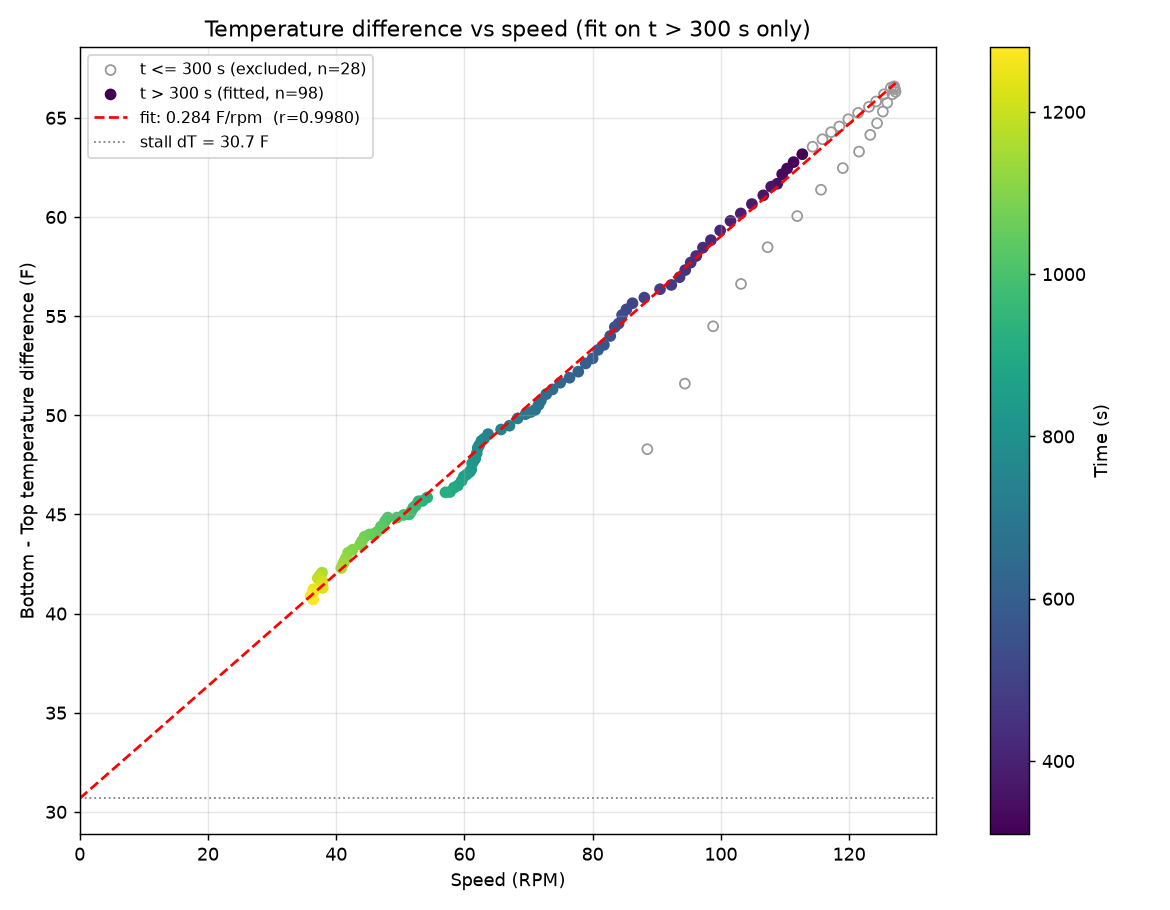
First lets circle back to some eyeballing we did earlier. We know that the flywheel speed depends on the difference between the top and bottom plate temperatures. Lets plot that relationship and see how good our eyes are. We know our bottom temperature rose quickly then became more linear so lets take that into consideration.
If we only use data after 300 seconds our speed vs temperature difference fits a straight line very well! This tells us that just by listening to clicks we can get a nice estimate of the top to bottom temperature difference.
The top and bottom temperature difference is neat but what we actually care about is the temperature of our coffee. We know the coffee heats up the bottom plate (with some losses). We also know the ambient temperature cools off the top plate. If we know the ambient temperature and how fast the flywheel is spinning can we predict how hot our coffee is??
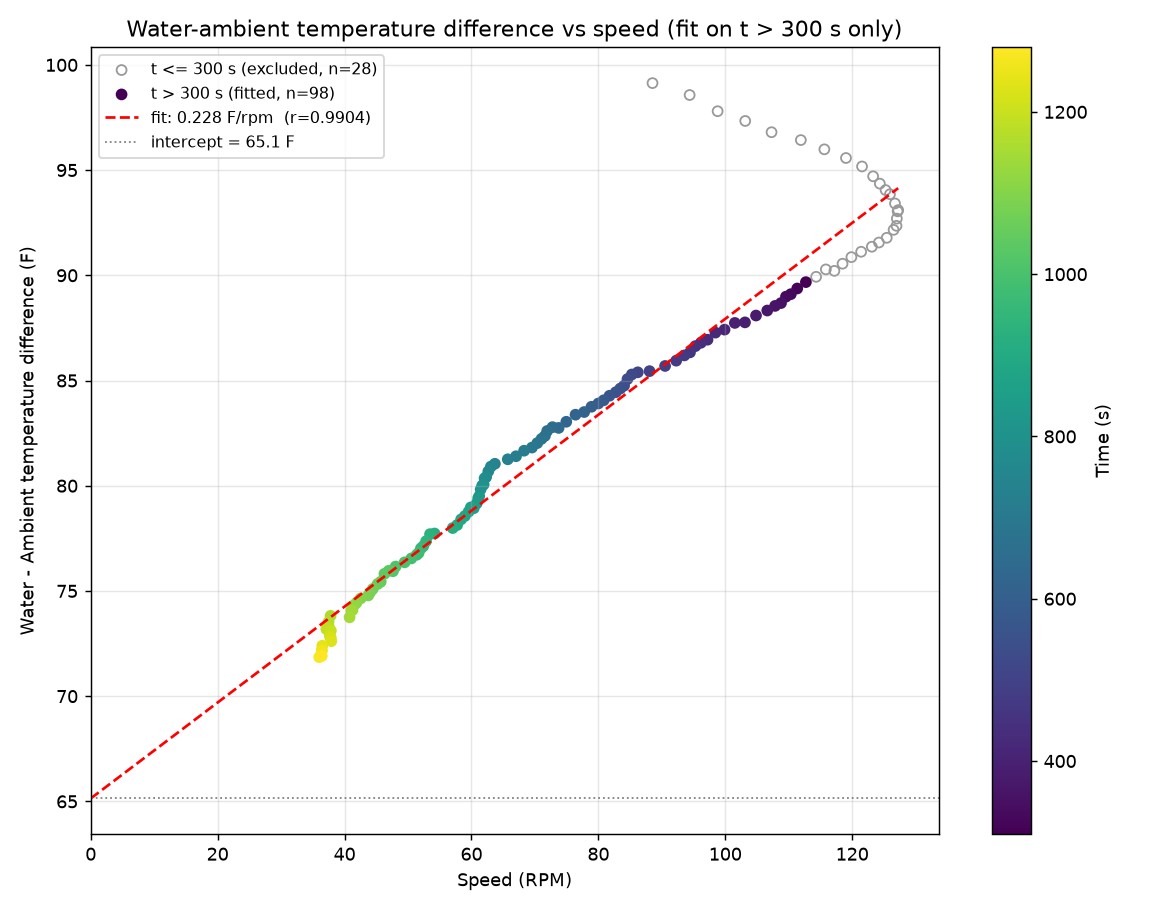
YES!!
The linear fit decreased slightly but it is still more than enough to tell us if our coffee is ready. The y-axis shows the temperature difference between ambient and the water/coffee. This means if you add your ambient temperature to that number you’ll get the coffee temperature.
Now, assuming you use a similar stirling engine to the one I did, you can use this yourself without an arduino and without an autocorrelation algorithm. 120rpm is 0.5 seconds per revolution. Thats not terribly fast. With a stop watch and a kitchen thermometer you could easily make a model that fits your environment, your mug, your stirling engine. Just pour some water/coffee, place the stirling engine, and take time and temperature measurements. Taking measurements every couple of minutes should be more than enough. Plop that into Excel and use the built in linear fit tool and it will give you the linear estimate if you want to predict the temperature. From that you could isolate your target temperature and know the speed you’re looking for. Even simpler, if you simply remember/measure what time between clicks equals a drinkable temperature, all you have to do is measure the time between clicks.
Click… Click… BOOM you have your temperature!